Caveats dominate
Focal Ablation vs IMRT Toxicity (SEER-Medicare)
ForLocalized prostate cancer, fee-for-service Medicare, mean age ~73
TL;DRGI toxicity favored focal therapy at 24mo (11.0% vs 21.5%, OR 0.45) but GU toxicity favored IMRT (41.7% vs 29.3%, OR 1.69).
The GI advantage rests on diagnosis claims alone: procedure-code-only GI events were too few to report and not significantly different, while the GU excess with FT was concrete (incontinence therapy 17.4% vs 7.5%). For an RT reader counseling an older man weighing ablation, that asymmetry is the point.
In an older man with localized prostate cancer choosing between focal ablation and IMRT, this supports counseling that the tradeoff runs GU-for-GI rather than uniformly lower toxicity with ablation; it does not extend to SBRT or proton patients, who were excluded.
The IMRT comparator is a 2010-2017, ≥20-fraction cohort with SBRT, protons and rectal hydrogel excluded, so the GI toxicity attributed to radiation predates spacer-era rectal sparing. That caps how much of this GI gap should carry into a current consent conversation, while the GU result (incontinence therapy 17.4% vs 7.5% favoring IMRT) transfers intact.
For ablation, the toxicity cost is concrete and periurethral: incontinence therapy 17.4% vs 7.5% and erectile dysfunction 18.2% vs 13.1%, both P<.01. The offsetting GI advantage collapsed in the procedure-only analysis, so the low-morbidity premise for cryotherapy and laser ablation in older men is weaker than the headline suggests.
10 details 5 trials watching
Retrospective SEER-Medicare claims analysis of localized prostate cancer diagnosed 2010-2017. 797 focal therapy patients Mahalanobis matched 2:1 to 1,594 IMRT patients on demographics, Medicaid eligibility, comorbidity, flu vaccination, primary care access, year, cancer characteristics and ADT. Logistic regression at 6, 12 and 24 months.
Fee-for-service Medicare beneficiaries with localized PCa as first and only cancer, continuously enrolled parts A and B from 12 months pre-diagnosis through 24 months post-treatment. New York, Idaho and Massachusetts registries excluded for missing AJCC staging. Patients who died within 24 months of treatment were excluded.
IMRT defined as external beam with no surgery plus ≥20 IMRT fractions and an IMRT planning code; a gap of ≥30 days between radiation dates counted as a separate course. SBRT and proton patients were excluded, as were patients with rectal hydrogel spacer, so the IMRT arm is conventional fractionation without a rectal spacer.
Presence of claims indicative of a GI or GU complication within 6, 12 and 24 months of treatment, assessed both as combined diagnosis and procedure codes and as procedure codes only. No patient-reported outcomes and no graded toxicity scale.
Direction reversed by organ system: GI favored focal therapy from 12 months onward, GU favored IMRT at every window measured. The 0-6 month GI comparison was null (OR 1.06, P=.81).
| Toxicity / window | FT | IMRT | OR (95% CI) |
|---|---|---|---|
| GI 0-6 mo | 3.6% | 3.5% | 1.06 (0.67-1.67), P=.81 |
| GI 0-12 mo | 6.2% | 9.5% | 0.63 (0.45-0.88) |
| GI 0-24 mo | 11.0% | 21.5% | 0.45 (0.35-0.58) |
| GU 0-12 mo | 34.6% | 15.8% | 2.69 (2.21-3.28) |
| GU 0-24 mo | 41.7% | 29.3% | 1.69 (1.42-2.01) |
GU excess with focal therapy was driven by incontinence therapy (17.4% vs 7.5%) and erectile dysfunction (18.2% vs 13.1%), both P<.01. GI events with IMRT were predominantly rectal bleeding and colitis; the authors note related procedures were rare and not significantly different.
Focal therapy patients were disproportionately rural (6.4% vs 1.9%) and lower-income (51.5% vs 38.7% in the lowest two quintiles) before matching, so claim-generating behavior may differ by arm independent of toxicity. Baseline continence and erectile function were unmeasured, which matters most for the two endpoints driving the GU result.
The GI result is fragile in a specific way the abstract does not foreground: it collapses to one diagnosis subcategory and disappears in the procedure-only analysis. The GU result is the more robust half, and it runs against the premise that ablation is the lower-toxicity option.
Claims-based retrospective matching, not randomised; toxicity defined by diagnosis codes, and the GI difference vanished when restricted to procedure codes. No PROs, no baseline function.
- Does the tradeoff hold vs SBRT or spacer-era IMRT? n=184 · primary completion 2027-06 · IRE vs prostatectomy or RT, side-effect endpointn=356 · primary completion 2029-08 · focal therapy vs usual care RCT, ISUP 2/3
- Do patient-reported outcomes track the claims-based GU signal? n=300 · primary completion 2030-12 · prospective validated urinary/sexual PROs after HIFUn=200 · primary completion 2032-03 · questionnaire outcomes across HIFU, cryo, laser, IRE
- Do HIFU and RFA carry the same GU profile as cryo/laser? n=354 · primary completion 2028-12 · HIFU hemi-ablation, continence + toxicity endpoints
📚 Sources · 📄 1 paper
Abstract
Cardiac Risk After Heart-Sparing Breast Radiotherapy
ForLeft-sided breast cancer, 3D-CRT or IMRT, 2008-2018
TL;DRMax LAD ≥12 Gy EQD2: sHR 1.81 (1.04-3.16) for cardiac events; mean heart dose ≥2 Gy null (P=.99), 2223 left-sided pts.
The number that reaches the planning system is the physical-dose translation: 12 Gy EQD2 max LAD is about 10.5 Gy at 42.5 Gy/16 fx and 7 Gy at 26 Gy/5 fx. Discrimination was weak for both metrics (C index 0.58 vs 0.53), so this argues for adding an LAD max objective and motion management, not for retiring mean heart dose.
In left-sided breast cancer planned with 3D-CRT or IMRT, this supports carrying an LAD max objective alongside the usual heart constraint; it does not extend to right-sided disease, which sat outside the primary analysis.
The actionable number is the physical-dose translation: 12 Gy EQD2 max LAD is about 10.5 Gy at 42.5 Gy/16 fx and 7 Gy at 26 Gy/5 fx, both checkable at the workstation. Discrimination was weak for both metrics (C index 0.58 vs 0.53), so this adds an LAD max objective and breath-hold rather than retiring the heart constraint.
9 details 4 trials watching
Cross-sectional cohort of 4908 breast cancer pts treated with 3D-CRT or IMRT from 2008 to 2018 at one Canadian tertiary center, 2223 left-sided in the primary analysis. Median follow-up 10.8 years (IQR 8.4-13.1). Dosimetry auto-segmented from planning CT, converted to EQD2; competing-risks (Fine and Gray) regression adjusted for cardiovascular risk factors.
Breast cancer treated with 3-dimensional conformal or intensity-modulated RT, 2008 to 2018, with the primary analysis restricted to left-sided disease. Systemic cardiotoxic exposure (anthracycline, trastuzumab) is not reported in source.
3D-CRT or IMRT across the heart-sparing era; LAD and heart automatically segmented and dose converted to EQD2. The threshold is a max point dose to the LAD, not a mean, and the reference schedules are moderate hypofractionation (42.5 Gy in 16 fx) and ultrahypofractionation (26 Gy in 5 fx).
Adverse cardiac events: MI, or admission / ED visit for unstable angina, arrhythmia, heart failure, pericarditis, myocarditis. Coronary angiography and revascularization captured separately as CAD. Discrimination compared by ROC C index, adjusted association by competing-risks regression.
10-year cumulative incidence of cardiac event or CAD was 5.0% (95% CI 4.1-6.0). Metric-by-metric comparison is in the table above.
| Metric | Max LAD dose | Mean heart dose |
|---|---|---|
| Discrimination (C index) | 0.58 (95% CI 0.52-0.64) | 0.53 (95% CI 0.47-0.60) |
| Adjusted association | ≥12 Gy EQD2: sHR 1.81 (1.04-3.16), P=.04 | ≥2 Gy: not associated, P=.99 |
| Schedule | Physical max LAD dose |
|---|---|
| 42.5 Gy / 16 fx | approx 10.5 Gy |
| 26 Gy / 5 fx | approx 7 Gy |
Current whole-heart constraints descend from population dose-response work on cohorts irradiated when incidental cardiac exposure was far higher (Darby, NEJM 2013), the era in which mean heart dose had usable spread. This is the modern counterpart of those series, and the reversal it reports is what you would expect if heart-sparing planning compressed mean heart dose below its discriminating range. The referenced schedules, 42.5 Gy in 16 fractions and 26 Gy in 5 fractions (FAST-Forward), are current practice, so the dosimetric translation transfers.
The mean heart dose null is hard to separate from restricted range: a 2 Gy dichotomy inside a heart-sparing cohort may not span enough exposure for a gradient to show. The endpoint counts coronary angiography and revascularization, which track ascertainment and access as well as biology. Systemic cardiotoxic exposure is not reported in source, leaving an obvious confounder unaddressed.
The asymmetry that matters is cost: an LAD max objective plus breath-hold usually costs optimization time, not target coverage, so a weak association is enough to justify it, while it would not justify trading away chest wall or nodal coverage. The measurement problem cuts the other way, since a max point dose to a small mobile auto-segmented vessel is among the least reproducible quantities to write into a protocol. Motion management carries the least methodological baggage of the two recommendations: it lowers LAD dose and heart dose together.
Cross-sectional single-center cohort with a cut point derived in the same data; C index 0.58 barely above chance and its interval overlaps mean heart dose's.
- External validation of the 12 Gy EQD2 LAD cut point
- Whether LAD-directed planning prospectively lowers cardiac events n=400 · primary completion 2026-04 · DIBH vs free-breathing cardiac dose, paired plansn=750 · primary completion 2027-12 · IMPT vs IMRT/VMAT, cardiac toxicity endpoint
- Generalizability to regional nodal irradiation and 5-fraction schedules active Postmastecomy Internal Mammary Nodal Irradiation for High-risk Breast Cancer Patients Phase 3n=2400 · primary completion 2025-11 · phase 3 IMN irradiation vs none, n=2400recruiting Ultra-Hypofractionated vs. Hypofractionated Radiation for Node-Positive Breast Cancer Phase 2n=220 · primary completion 2034-04 · randomised ultra-hypofx vs hypofx with nodal RT
📚 Sources · 📄 1 paper
Abstract
ProtecT (cribriform morphology secondary analysis)
ForPSA-screened clinically localized prostate cancer, cribriform status on diagnostic biopsy
TL;DRSecondary analysis: cribriform-negative disease (87% of reviewed cohort) got no significant 15-yr metastasis reduction from early radical treatment vs monitoring.
Reported via UroToday →
For the RT reader this is a selection question, not a technique one: it asks whether cribriform status identifies the ProtecT subgroup that actually earned the metastasis reduction from radical treatment. RT here was EBRT with 3-6mo neoadjuvant ADT, a dated backbone. No subgroup HRs, CIs or event counts appear in the source excerpt.
In PSA-screened clinically localized disease with cribriform-negative grade group 2 on biopsy, this analysis supports treating long-term metastasis risk as comparable to grade group 1; it says nothing about cribriform-positive pts, where guidelines already discourage surveillance.
The decision this moves is whether to offer definitive RT at all, not how to deliver it: cribriform-negative grade group 2 showed metastasis risk equivalent to grade group 1 at 15 years. The RT arm was EBRT with 3-6mo neoadjuvant ADT in a pre-MRI, systematic-biopsy cohort, so transferability to current practice is limited. No subgroup effect sizes in source.
Relevant to how neoadjuvant ADT exposure is weighed against a metastasis benefit that this analysis does not find in the 87% cribriform-negative majority. ProtecT's ADT was 3 to 6 months alongside EBRT. The result argues for a biomarker-gated rather than grade-group-gated treatment decision.
Bears on the counselling conversation before radical prostatectomy in grade group 2: cribriform-negative pts carried the same 15-year metastasis risk as grade group 1, supporting surveillance discussion in that stratum. Cribriform-positive disease is untouched by this read, and guidelines already discourage surveillance there.
9 details
Secondary pathological analysis of the ProtecT randomized trial (active monitoring vs radical prostatectomy vs EBRT with neoadjuvant ADT). Central review of biopsy slides retrieved for 712 of 1,643 randomized pts, with both intention-to-treat and per-protocol analyses, the latter accounting for crossover to radical treatment.
PSA-screened men with clinically localized prostate cancer, the original ProtecT eligibility. Slides were regraded under 2019 ISUP criteria rather than the trial-era 2005 criteria; the presenter reports regrading did not change the picture. Age, PSA and revised Gleason score did not differ significantly across arms in the reviewed subset.
The RT arm was external-beam radiotherapy with 3 to 6 months of neoadjuvant ADT. No dose, fractionation or target volume is given in the source. The presenter notes cribriform-positive disease was more prevalent in this arm, attributed to chance since cribriform status was not a randomization characteristic.
Primary: metastases at 15-year median follow-up, analysed by cribriform status. Multivariable Cox modelling was used to compare metastasis risk across grade groups within the cribriform-negative stratum.
Roughly 13% of the reviewed cohort was cribriform-positive. Among the 87% cribriform-negative, early radical treatment produced no statistically significant reduction in 15-year metastases vs active monitoring, in both ITT and per-protocol analyses. Cribriform-negative grade group 2 carried metastasis risk equivalent to grade group 1.
Slides were available for under half the randomized cohort, so the analysis rests on whichever centres have so far returned material. The source excerpt is a video interview that stops mid-presentation and reports no HRs, CIs or event counts, so the size of the null in the cribriform-negative group cannot be judged from it.
The interest here is the inverse of the usual cribriform argument. Rather than showing cribriform-positive pts do badly on surveillance, the useful signal is that cribriform-negative grade group 2 behaves like grade group 1 over 15 years, which is a de-escalation read. Whether the cribriform-positive stratum shows the reciprocal benefit is not in the source excerpt.
Post-hoc subgroup of a non-stratified variable in 712 of 1,643 pts, with a non-significant negative result and no effect sizes in the source.
- Metastasis outcomes in the cribriform-positive stratum on active monitoring
- Whether cribriform status holds as a marker in MRI-targeted biopsy cohorts
- Reproducibility of binary cribriform calls across pathologists
📚 Sources · 📄 1 paper
Abstract
ctDNA and Local Regrowth/Distant Mets in Nonoperative Rectal Cancer
ForMSS stage I-III rectal ca, cCR/nCR after NAT, on nonoperative management
TL;DRctDNA sensitivity for local regrowth only 41% (12/29), specificity 94%; distant mets sensitivity 74%, specificity 97%.
The number that gates watch-and-wait practice is 41% sensitivity for local regrowth (12/29 samples): a negative ctDNA cannot license lengthening MRI or endoscopy intervals in an organ-preservation protocol. Specificity 94% means a positive result is worth acting on, and ctDNA+ at regrowth tracked ypT3-4 in 6/8 vs 3/14 (p=0.01).
In a stage I-III MSS rectal pt in watch-and-wait after TNT or CRT, a positive ctDNA supports intensified assessment for regrowth or distant disease; a negative result does not support relaxing endoscopic or MRI surveillance intervals.
Watch-and-wait after TNT or chemoRT is an RT-owned pathway, and this says the surveillance burden that sustains it cannot be shifted to blood. Sensitivity for local regrowth was 41% (12/29); a negative ctDNA does not support lengthening MRI or proctoscopy intervals in a pt whose rectum you preserved.
The distant-metastasis read is where ctDNA earns its place: sensitivity 74%, specificity 97% (31/42 and 611/627), versus 41% locally. That supports using serial ctDNA to trigger systemic restaging and escalation decisions, not to arbitrate local status.
ctDNA positivity at the time of regrowth tracked more advanced salvage pathology: ypT3-4 in 6/8 (75%) vs 3/14 (21%), p=0.01. A regrowth found in a ctDNA-positive pt is more likely to be a deeper-invading tumor, which informs how the salvage TME is planned rather than whether it is offered.

| Outcome | Sensitivity | Specificity | Accuracy |
|---|---|---|---|
| For local regrowth | 12 / 29 (41%) | 480 / 509 (94%) | 492 / 538 (91%) |
| For distant metastasis | 31 / 42 (74%) | 611 / 627 (97%) | 642 / 669 (96%) |
11 details
Single-institution cohort from MD Anderson's INTERCEPT program, 2020-2024, N=110, with serial tumor-informed ctDNA during nonoperative management. Median follow-up 25 months (IQR 18-37).
Microsatellite stable stage I-III rectal adenocarcinoma achieving cCR or near-cCR after neoadjuvant therapy and managed nonoperatively. Median age 56; baseline cT3 in 72 and cT4 in 16; 69 received TNT, 41 CRT or chemotherapy alone.
Local regrowth and distant metastasis by longitudinal ctDNA status, by first post-NAT ctDNA (within 180 days), and per-sample accuracy for an event within ±90 days of each draw. Salvage-surgery pathology by ctDNA status at regrowth.
Twenty-three pts (21%) had local regrowth and 12 (11%) distant metastasis. Ever-positive ctDNA separated both curves (log rank p=0.0002 for regrowth, p<.0001 for metastasis). The per-sample table carries the operating characteristics.
Per-sample analysis pools 669 draws from 110 pts without accounting for repeated measures, so the confidence around 41% is softer than the denominator suggests. The first-post-NAT comparison rests on n=12 evaluable pts as reported in the source. No comparison against MRI or endoscopy, the tests ctDNA would have to beat.
The asymmetry between local (41%) and distant (74%) sensitivity is the informative result: intraluminal regrowth from a small residual burden sheds too little DNA to be caught reliably, while metastatic disease does. That biology argues for ctDNA as a distant-recurrence tool layered onto, not substituted for, luminal surveillance.
Retrospective single-center cohort; per-sample analysis treats 669 draws from 110 pts as independent. No head-to-head against MRI/endoscopy surveillance.
- Does ctDNA add anything over MRI plus endoscopy in NOM surveillance?
- Can draw timing or a lower assay threshold raise local regrowth sensitivity?
- Does ctDNA-triggered restaging improve salvage outcomes?
📚 Sources · 🐦 1 tweet
Important study re: ctDNA for non-op surveillance in rectal ca.
— Dr. Nina Niu Sanford (@NiuSanford) June 1, 2026
Pos ctDNA associated w regrowth (60%) & distant mets (60%), but neg ctDNA doesn't exclude local regrowth (sensitivity only 41%)
ctDNA good for risk stratification but not surveillance replacement #ASCO26 @OncoAlert pic.twitter.com/UQQub5QfNB
DeLLphi-304
For2L SCLC after platinum, with or without baseline brain metastases
TL;DRPost hoc CNS analysis: median CNS PFS NE vs 7.2mo, HR 0.54 (0.39-0.75) favoring 2L tarlatamab in SCLC.
For an RT reader the actionable number is the brain-met subset: CNS PFS 6.5 vs 4.2mo, HR 0.40 (0.24, 0.66) by mRANO-BM BICR, with CNS CR 14.9% vs 5.4%. But >70% had prior CNS-directed treatment and no RT exposure or intracranial-failure pattern is reported, so this informs surveillance interval rather than deferring SRS.
In relapsed SCLC with treated, asymptomatic brain metastases entering 2L, this supports tarlatamab as systemic therapy with meaningful intracranial activity; it does not address untreated or symptomatic CNS disease, where local therapy remains the studied path.
The brain-met subset read by mRANO-BM BICR gives CNS PFS 6.5 vs 4.2mo, HR 0.40 (0.24, 0.66), which is the number to hold against a systemic-only strategy. But >70% had prior CNS-directed therapy and neither RT exposure nor in-field versus out-of-field failure is reported, so it moves the surveillance interval, not the decision to offer SRS.
Intracranial activity is now a differentiator for tarlatamab in 2L SCLC rather than an unknown: CNS CR 14.9% vs 5.4% and CNS disease control 77.6% vs 71.4%, with median duration of CNS disease control 8.2 vs 5.2mo. That supports keeping a pt with treated, stable brain metastases on the bispecific rather than defaulting to chemotherapy for CNS coverage.

| Arm | n | Median CNS PFS (95% CI) | HR (95% CI) |
|---|---|---|---|
| Tarlatamab | 67 | 6.5 (4.3, 13.7) | 0.40 (0.24, 0.66) |
| Chemotherapy | 56 | 4.2 (2.9, 5.5) | n/a |
+2 more figures

| Arm | n | Median CNS PFS (95% CI) | HR (95% CI) |
|---|---|---|---|
| Tarlatamab | 254 | NE (13.7, NE) | 0.54 (0.39, 0.75) |
| Chemotherapy | 255 | 7.2 (5.6, NE) | n/a |
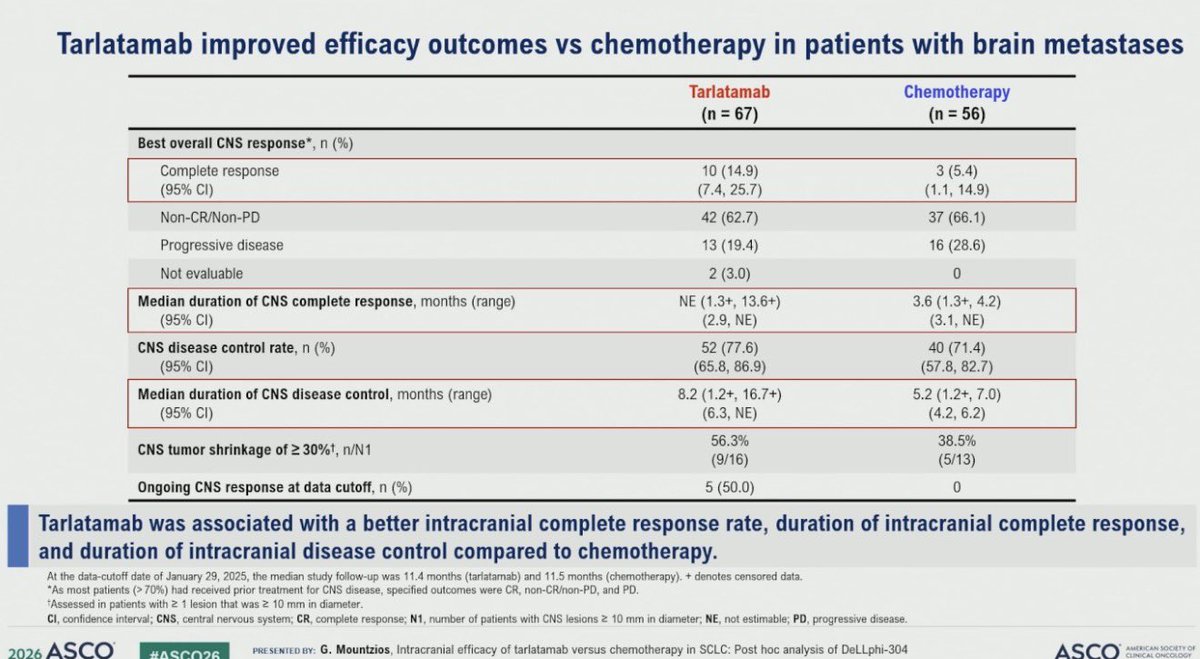
| CNS outcome | Tarlatamab (n=67) | Chemotherapy (n=56) |
|---|---|---|
| Complete response, n (%) | 10 (14.9) | 3 (5.4) |
| Non-CR/non-PD, n (%) | 42 (62.7) | 37 (66.1) |
| Progressive disease, n (%) | 13 (19.4) | 16 (28.6) |
| CNS disease control rate, n (%) | 52 (77.6) | 40 (71.4) |
| Median duration of CNS disease control, mo | 8.2 (1.2+, 16.7+) | 5.2 (1.2+, 7.0) |
10 details 1 trial watching
Post hoc intracranial analysis of the randomised DeLLphi-304 trial of second-line tarlatamab versus chemotherapy in SCLC. Two assessment frameworks: investigator RECIST in the ITT population and mRANO-BM by BICR in pts with baseline brain metastases. Data cutoff January 29, 2025; median follow-up 11.4 mo (tarlatamab) and 11.5 mo (chemotherapy).
ITT n=254 tarlatamab versus n=255 chemotherapy. The brain-metastasis cohort was n=67 versus n=56, defined as ≥1 brain metastasis at baseline per mRANO-BM by BICR plus ≥1 post-baseline scan. More than 70% had already received CNS-directed treatment, which is why the response categories were CR, non-CR/non-PD and PD rather than a conventional ORR.
This analysis reports time to CNS progression or death (CNS PFS) in the ITT population and in the brain-metastasis subset, plus best overall CNS response, CNS disease control rate, duration of CNS complete response and duration of CNS disease control. None of these was the trial's registered primary endpoint.
Both CNS PFS comparisons favor tarlatamab, and the effect is larger in the brain-metastasis subset (HR 0.40) than in the ITT population (HR 0.54). Intracranial complete response was 14.9% versus 5.4%, and CNS tumor shrinkage ≥30% occurred in 9/16 versus 5/13 pts with measurable lesions ≥10mm.
Brain metastases develop in the majority of SCLC pts, and second-line systemic options have historically been judged on extracranial disease with CNS control assumed to be the province of SRS, WBRT or prophylactic cranial irradiation. A bispecific T-cell engager showing an intracranial complete response rate of 14.9% is the notable part, because the working assumption for large-molecule agents has been limited intracranial penetration.
The ITT median CNS PFS was not estimable at 11.4 months of follow-up, so the ITT curve rests on the early portion of the data and the point estimate can still move. The two populations were also read with different tools and different models (stratified Cox for ITT, unstratified for the subset), so the ITT and subset HRs are not strictly comparable to each other.
The result establishes that intracranial disease does not progress faster under tarlatamab than under chemotherapy, and probably progresses more slowly. What it does not establish is whether that activity is sufficient to defer local therapy in a patient who would otherwise be referred for SRS, since the source reports no radiotherapy exposure data and no in-field versus out-of-field failure pattern.
Post hoc intracranial analysis of a randomised trial; CNS endpoints were not the registered primary, and the brain-met subset HR comes from an unstratified model.
- Does intracranial activity permit deferral of SRS in untreated brain mets
- Activity in CNS-treatment-naive or symptomatic brain metastases n=35 · primary completion 2029-02 · phase 2 tarlatamab, active asymptomatic brain mets
- Durability of CNS control beyond 12 months follow-up
📚 Sources · 🐦 1 tweet
Dr. @g_mountzios #ASCO26 presents CNS outcomes with 2L tarlatamab in DeLLphi-304. Improved time to CNS progression overall (HR 0.54). In pts with brain nets, tarlatamab vs chemo CNS CR rate 15% vs 5% with DCR 78% vs 71% and time to CBS progression 6.5m vs 4.2m, HR 0.40 pic.twitter.com/5i8jL1zlKW
— Stephen V Liu, MD (@StephenVLiu) June 1, 2026
ENZAMET + Decipher
FormHSPC on ADT + enzalutamide, Decipher score available
TL;DRDecipher >0.85 predicts docetaxel benefit in mHSPC on ADT+enza: HR(OS) 0.75 (0.43-1.33) vs 1.94 (0.95-3.96) if ≤0.85, interaction p=0.04.
In mHSPC starting ADT + enzalutamide with a Decipher score available, this offers hypothesis-level support for weighing docetaxel intensification above the 0.85 cut and for questioning it below; it does not extend to patients on other ARSIs or to those without genomic testing.
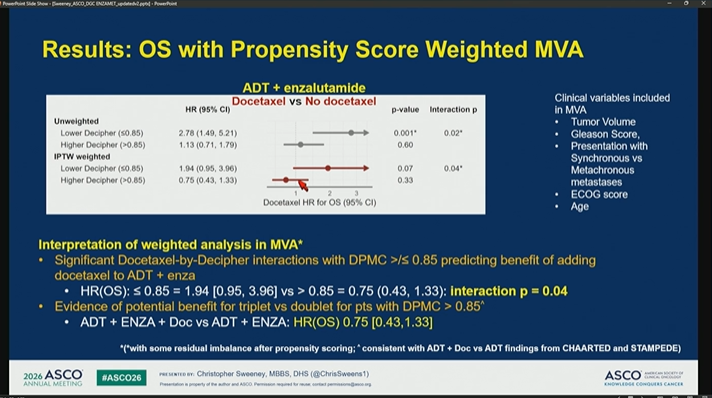
| Analysis | Lower Decipher (≤0.85) | Higher Decipher (>0.85) | Interaction p |
|---|---|---|---|
| Unweighted HR (95% CI) | 2.78 (1.49, 5.21) | 1.13 (0.71, 1.79) | 0.02 |
| Unweighted p-value | 0.001 | 0.60 | |
| IPTW weighted HR (95% CI) | 1.94 (0.95, 3.96) | 0.75 (0.43, 1.33) | 0.04 |
| IPTW weighted p-value | 0.07 | 0.33 |
+2 more figures


8 details
Post-hoc genomic-classifier analysis of the ENZAMET ADT + enzalutamide cohort, N=320, testing whether Decipher (DPMC) predicts docetaxel benefit. Docetaxel receipt was investigator-elected, not randomised, so a propensity-score IPTW model carries the comparison.
mHSPC on an ADT + enzalutamide backbone with an evaluable Decipher score, split at the prespecified 0.85 cut. A separate panel restricts to low-volume disease.
Overall survival, read two ways: prognostic (Decipher stratum on ADT + enza) and predictive (docetaxel-by-Decipher interaction).
Prognostic signal is the cleanest number on the slide deck: HR 3.02 (1.50-5.76) for DPMC >0.85 on ADT + enza. The predictive claim rests on the interaction, p=0.02 unweighted and p=0.04 after IPTW, not on either stratum reaching significance.
Docetaxel was not randomised within this cohort, so IPTW is doing the causal work and the authors concede residual imbalance after propensity scoring. Low-volume panel numbers are small (n at risk 14 and 13 in the reported strata) with a CI of 1.70 (0.32, 8.06), wide enough to be uninformative.
Presented as level 1B evidence consistent with CHAARTED and STAMPEDE, where docetaxel benefit concentrated in high-volume disease. This analysis proposes a genomic rather than volumetric selector for the same decision.
The strongest defensible claim is the prognostic one: DPMC >0.85 marks worse OS on ADT + enza. The predictive claim (add docetaxel above 0.85, omit it below) is directionally consistent across unweighted and weighted models but is not established by a single non-randomised interaction.
Post-hoc biomarker subgroup with non-randomised docetaxel use; both stratum HRs non-significant after weighting, residual imbalance conceded. Read rests on an interaction p=0.04.
- Prospective validation of Decipher-guided docetaxel selection in mHSPC
- Does the 0.85 cut hold on ARSI backbones other than enzalutamide
- Whether low Decipher predicts docetaxel harm or only absent benefit
📚 Sources · 🐦 1 tweet
#ASCO26 GU Oncology Spotlight 🚨
— Dra. María Natalia Gandur Quiroga (@nataliagandur) May 30, 2026
🔬 ENZAMET + Decipher | Part 2
Can genomics guide docetaxel intensification in mHSPC?
Outstanding presentation by @ChrisSweeney1.@OncoAlert@ASCO
After Part 1, the key question was:
➡️ Can a genomic classifier identify which patients with… pic.twitter.com/nJYMxuXelV
Clinico-transcriptomic Risk Stratification (Abstract 5000)
ForNCCN high-risk / very-high-risk localized prostate, definitive RT + ADT
TL;DR~¼ of NCCN ≥HR pts carry discordant clinical vs biomarker risk; 22-gene GC independently prognostic for MFS, DM, OS.
The de-escalation cell is where the risk sits: 9% of NCCN ≥HR pts read clinically high but biomarker low, and the framework withholds AAP from them. The 15% running the other way is the easier sell. What moves is whether GC gets ordered at consult, not any planning parameter.
In NCCN high-risk or very-high-risk localized prostate headed for definitive RT + ADT, this supports ordering a 22-gene GC before the abiraterone decision; it does not speak to post-prostatectomy salvage, node-positive, or metastatic disease.
RT + ADT is fixed in both branches, so nothing here touches dose, target volume, or fractionation; the framework is a consult-time test-order decision. Reclassification runs both ways, 15% clinically lower but biomarker higher and 9% the reverse, on GC bands of 0.6 and 0.85.
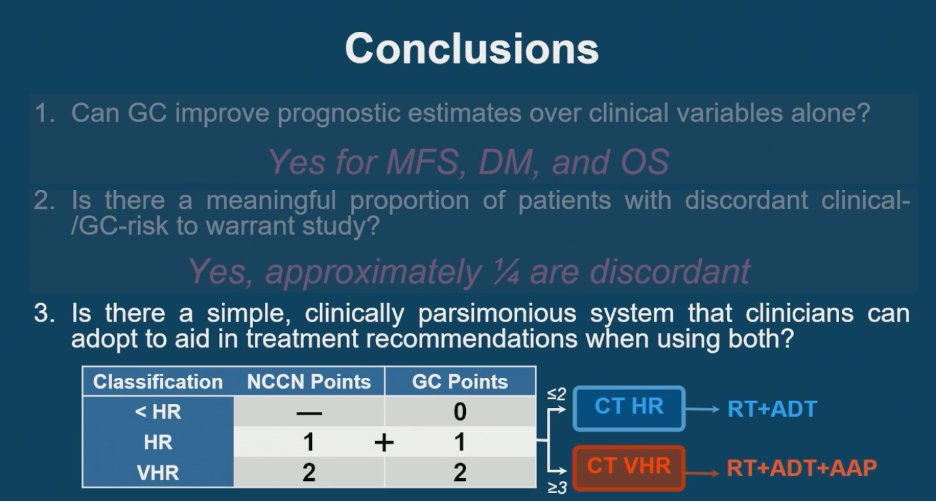
Intensification with AAP in localized disease gets a biomarker gate instead of an NCCN label: NCCN class and GC each contribute up to 2 points, and a sum ≥ 3 triggers AAP. GC was tested as prognostic across MFS, DM, and OS; no treatment-by-GC interaction is reported, so predictive value is unestablished.

+3 more figures

| Clinical risk | ↓ Biomarker | ↑ Biomarker |
|---|---|---|
| ↓ Clinical | 49% | 15% |
| ↑ Clinical | 9% | 27% |

8 details
Clinico-transcriptomic analysis of NRG cohorts modeling the 22-gene GC as a continuous variable (per 0.1 unit) alongside clinical covariates, with treatment carried as a covariate. Contributing trials, N, and follow-up duration are not reported in the source.
NCCN ≥ high-risk localized prostate, spanning NCCN HR and VHR. Baseline age, PSA, and grade distributions are not reported in the source.
Every branch of the framework keeps RT + ADT. No dose, fractionation, target volume, or ADT duration is reported, so RT enters as a fixed backbone rather than a variable under test.
Prognostic performance assessed on MFS, distant metastasis, and OS. No single primary endpoint is stated, and the framework itself is not compared against a randomized alternative.
GC was independently prognostic for all three endpoints (p<0.001); the row-level hazard ratios are not legible in the source slide. Approximately ¼ of the ≥HR population carries discordant clinical vs biomarker risk.
| Score (NCCN + GC) | CT risk | Recommendation |
|---|---|---|
| ≤ 2 points | CT HR | RT + ADT |
| ≥ 3 points | CT VHR | RT + ADT + AAP |
STAMPEDE M0 (Attard, Lancet 2022) is the external yardstick: the CT HR and CT VHR curves are overlaid on that trial's RT + ADT arm rather than on a randomized internal control. Eligibility, staging era, and ADT duration differ between cohorts, so the vertical gap carries trial effects alongside risk-group effects.
The GC term's hazard ratios and confidence intervals are not legible in the source, so the size of the increment over clinical variables cannot be checked. The 9% clinically-high / biomarker-low cell is where the framework withholds intensification, and its outcomes are the ones a reader most needs before acting.
The contribution is a parsimonious integer score computable at the consult desk, extending Spratt et al. (JCO 2018) to the modern VHR population. What it does not settle is whether the signal separating these curves also identifies who benefits from AAP: a prognostic split widens absolute benefit for a uniformly effective drug without any interaction, and none is reported here.
Retrospective pooled analysis; GC shown prognostic, not predictive. Intensification threshold benchmarked against STAMPEDE across trials, not randomized within cohort; no treatment-by-GC interaction in source.
- Does GC predict abiraterone benefit or only prognosis?
- Prospective validation of the ≥3-point intensification threshold
- Whether NCCN VHR pts with GC < 0.6 can omit AAP
📚 Sources · 🐦 2 tweets
#ASCO26 GU Oncology Spotlight 🚨
— Dra. María Natalia Gandur Quiroga (@nataliagandur) May 30, 2026
🔬 Abstract 5000 | High-risk prostate cancer
Clinico-transcriptomic risk stratification to guide abiraterone intensification
Presented by Krishnan R. Patel, MD, MHS@Krishnan_Patel@OncoAlert@ASCO
In high-risk localized prostate cancer,… pic.twitter.com/pZSCiTyGB8
#ASCO26 Dr. Patel presented a clinically practical framework integrating NCCN clinical risk + a 22-gene genomic classifier to guide treatment intensification in high-risk localized prostate cancer.
— Julian Chavarriaga (@chavarriagaj) May 30, 2026
Key findings:
🔹 The genomic classifier independently improved prognostic… pic.twitter.com/fRcdTmfBec
SPIN Score (Celiac Plexus Radiosurgery) NCT03323489
ForPancreatic cancer with retroperitoneal pain considered for celiac plexus SRS
TL;DRPost-hoc predictors of pain response after celiac SRS: response 32% / 53% / 89% by 0 / 1 / 2 SPIN points.
The actionable RT read is timing, not technique: neurotoxic chemo exposure carried OR 5.1 (p=0.009) against response, so the referral decision moves earlier in the disease course, before oxaliplatin or taxane neuropathy. Celiac SRS is NCCN-listed and single-fraction, so the gate is who you irradiate and when, not dose.
In pancreatic cancer pts with retroperitoneal pain scoring above 6 and no prior neurotoxic chemo, this supports considering celiac SRS earlier rather than after systemic lines; it does not tell you what to do for the chemo-exposed, low-pain pt, where response was 32%.
The gate on celiac SRS is patient selection and timing, not plan quality: neurotoxic chemo exposure carried OR 5.1 (p=0.009) against pain response, and 2-point pts responded 89% vs 32% at 0 points. Argues for taking the referral early rather than as last-line salvage.
The variable that mattered is one med onc controls: prior neurotoxic chemotherapy predicted failure of celiac SRS (OR 5.1, p=0.009). For a pt with severe retroperitoneal pain, this argues for a celiac SRS referral alongside, not after, an oxaliplatin or taxane backbone.

| SPIN score | n | Pain response |
|---|---|---|
| 0 | 31 | 32% |
| 1 | 40 | 53% |
| 2 | 19 | 89% |
10 details
Post-hoc analysis of the pivotal single-arm phase 2 celiac plexus radiosurgery trial (NCT03323489), n=90 evaluable. Candidate baseline predictors screened by univariate then multivariate logistic regression, with only multivariate-significant variables carried into the score. Internal validation by bootstrap resampling, 500 iterations, for an optimism-corrected AUC.
Pain response per parent protocol: a ≥2-point reduction in average pain on the Brief Pain Inventory-Short Form, baseline to three weeks. Parent-trial response was 53% (95% CI 42-64%).
Only neurotoxic chemotherapy exposure (OR 5.1, p=0.009) and baseline pain intensity (OR 1.8, p=0.003) survived multivariate analysis; age and therapy line dropped out to collinearity. The resulting 2-point score separated response into 32% / 53% / 89%, with AUC 0.716 apparent, 0.714 optimism-corrected.
| Predictor | Univariate | Multivariate |
|---|---|---|
| Neurotoxic chemo exposure | OR 5.33 (2.13-13.4), p<0.001 | OR 5.1, p=0.009 |
| Baseline pain intensity | OR 1.73, p=0.003 | OR 1.8, p=0.003 |
| Age | OR 1.06, p=0.014 | lost significance |
| Therapy line | OR 0.65, p=0.04 | lost significance |
The score was derived and internally validated in the same 90 pts, so the bootstrap corrects optimism from resampling but not from the variable-selection step that preceded it. The 2-point stratum is n=19, and the dichotomy at pain >6 was picked from the same data that shows steeper response above 7 and 8.
The neurotoxic-chemo term is the interesting one because it is a timing variable a clinician controls, not a fixed patient trait: it implies referral for celiac SRS competes with the systemic sequence rather than following it. Whether that reflects true nerve injury blunting an ablative pain response, or confounding by later-line disease biology, the post-hoc design cannot separate.
Post-hoc derivation on the parent trial's own 90 pts; internal bootstrap only, no external cohort. Design dominates the read regardless of effect size.
- External validation of the SPIN score in an independent cohort
- Is neurotoxic chemo effect causal or a proxy for later-line disease
- Durability of pain response beyond the 3-week endpoint
📚 Sources · 🐦 1 tweet
Celiac SRS = convenient, effective tx for intractable pain, but who benefits most?
— Dr. Nina Niu Sanford (@NiuSanford) May 30, 2026
Post-hoc Ph2 analysis identified 2 response predictors (SPIN score): severe baseline pain & no prior neurotoxic chemo.
Supports earlier use before potential chemo neuropathy. #ASCO26 @OncoAlert pic.twitter.com/3qFYU6N1iD
Proton vs Photon PMRT Capsular Contracture
ForPost-mastectomy breast cancer, implant-based reconstruction (TE/I or DTI), receiving PMRT
TL;DR2yr CC 50% with proton+DTI vs 12% photon+TE/I; proton HR 2.3 univariate, 1.76 (0.93-3.32) multivariable, ns.
The actionable variable is reconstruction type, not beam: DTI carried HR 3.0 (1.7-5.5) for CC independent of modality, and proton+DTI was the worst cell at 50% at 2 years vs 12% for photon+TE/I. That reframes the pre-RT conversation with plastic surgery toward staged TE/I when protons are planned, rather than toward declining protons outright.
In a woman heading to PMRT after mastectomy with implant reconstruction, this informs the timing and type of reconstruction discussed with plastic surgery when proton is on the table; it says nothing about autologous reconstruction or prepectoral placement, neither of which was studied.
The proton CC signal did not survive adjustment (HR 1.76, 0.93-3.32, P=.083), so this is not on its own grounds to decline protons where cardiac sparing is the indication. It is grounds to know the reconstruction plan before simulation: proton with DTI hit 50% CC at 2 years, and every TE/I patient here was irradiated with the expander in place.
Reconstruction type outweighed beam modality: DTI carried HR 3.0 (1.7-5.5) for CC versus staged TE/I on multivariable analysis. When PMRT is planned, particularly proton PMRT, that argues for staging the reconstruction rather than direct-to-implant, in subpectoral placement at least, which is all this cohort covers.
9 details
IRB-approved retrospective cohort at 2 centers within one institution, PMRT delivered 2017-2023. N=175 (89 PBS proton, 86 IMRT photon). CC estimated by Kaplan-Meier, with Cox proportional hazards for covariates and a binary logistic model as verification.
Breast cancer pts who underwent subpectoral 2-stage TE/I or DTI reconstruction and then PMRT. Median age 49 (range 24-78), 63% Hispanic. Groups were balanced except on tumor laterality (P < .001) and reconstruction type (P < .001), the two axes the analysis turns on.
Pencil beam scanning proton PMRT vs IMRT photon PMRT. All TE/I pts had the tissue expander in place and irradiated, so this cohort speaks to expander-in-situ RT, not to post-exchange irradiation of a permanent implant. Dose and fractionation are not reported in source.
Proton was associated with CC on univariate analysis (HR 2.3, 1.26-4.30, P=.007) but the association did not hold after adjustment (HR 1.76, 0.93-3.32, P=.083). DTI vs TE/I carried HR 3.0 (1.7-5.5), P < .001 in the multivariable model. No other factor was significantly associated with CC.
| Group | n | 2yr CC rate |
|---|---|---|
| Proton + DTI | 36 | 50% |
| Photon + DTI | 15 | 35% |
| Proton + TE/I | 53 | 23% |
| Photon + TE/I | 71 | 12% |
Modality was assigned by practice pattern, not randomized, so the residual proton association could be confounding the model did not capture. CC is clinician-graded on unblinded chart review, and the DTI cells are thin (36 proton, 15 photon), which is where the widest rate gap sits.
The paper set out to test a prespecified suspicion that protons increase CC and returned a trend that did not clear significance once reconstruction type entered the model. What it does establish is the interaction cell worth counseling on: proton + DTI at 50% CC at 2 years.
Retrospective, non-randomized modality assignment with baseline imbalance in reconstruction type and laterality; the proton signal loses significance once adjusted.
- Does prepectoral placement change the proton CC signal?
- Expander-in-situ vs post-exchange RT sequencing for implant reconstruction
- Proton PMRT reconstruction toxicity in a prospective randomized comparison
📚 Sources · 📄 2 papers
Abstract
NRG/RTOG 9804 + E5194 combined analysis
ForGood-risk DCIS post-lumpectomy, low/int grade, ≤2.5 cm, margins ≥3 mm, no RT
TL;DR15yr IBR 11.4% vs 19.0% with tamoxifen after lumpectomy alone in good-risk DCIS; MVA HR 0.54 for any IBR.
For the RT-omission conversation this is the other half of the ledger: in the same good-risk cohort 9804 randomized to RT, endocrine therapy alone carried 15-yr IBR 11.4% vs 19.0%, and the benefit sits entirely on invasive IBR (HR 0.43) rather than DCIS-IBR (P=.089). No RT-vs-tamoxifen comparison is reported in source, so this sizes the alternative, it does not substitute for it.
For the patient with low/intermediate-grade DCIS ≤2.5 cm and ≥3 mm margins who has already declined radiotherapy, this quantifies what endocrine therapy adds over surveillance alone at 15 years; it does not inform high-grade, larger, or close-margin DCIS, nor patients receiving RT.
This sizes the non-RT alternative in the very cohort 9804 randomized to RT or observation: 15-yr IBR 11.4% vs 19.0%, with the effect concentrated on invasive IBR (HR 0.43) and absent for DCIS-IBR (P=.089). No RT-versus-tamoxifen comparison exists in source, so it informs the omission discussion without answering it.
Endocrine therapy in good-risk DCIS buys a 46% relative reduction in any IBR (HR 0.54) and 57% in invasive IBR at a median 14.85 years, but the source gives no ER status, duration or adherence data, so the number cannot be gated to a receptor-defined subgroup. Uptake was only 43.1%, itself non-random.
Margin and excision quality track with the exposure rather than being controlled for it: tamoxifen users more often had a negative re-excision (27.2% vs 10.6%) and size ≤5 mm (57.0% vs 41.3%). For a surgeon this reinforces that the ≥3 mm margin plus small low/intermediate-grade lesion is the substrate on which these 15-year numbers rest.
9 details 3 trials watching
Ancillary exploratory combined analysis of two cooperative-group datasets, not a new randomization. Tamoxifen use was optional in both parent trials, so the tamoxifen comparison is observational; Fine-Gray univariate and multivariable models were used for the competing-risk endpoints.
N=878: the non-RT arm of NRG/RTOG 9804 (n=317) plus the good-risk cohort of E5194 (n=561). Good-risk was defined identically across both: low- or intermediate-grade DCIS, ≤2.5 cm, margins ≥3 mm. Median age 59 (28-88).
Lumpectomy alone without radiotherapy, with or without tamoxifen by patient/physician choice. Overall uptake 43.1%, but lopsided by trial: 65.6% in NRG/RTOG 9804 versus 30.3% in E5194.
No radiotherapy in any analyzed patient by design: the 9804 contribution is its observation arm and E5194 was a non-RT cohort. The result therefore describes the population in which a reader has already elected RT omission.
IBR, invasive IBR, DCIS-IBR, contralateral breast event and overall survival, compared between tamoxifen groups. Median follow-up 14.85 years overall (13.87 in 9804, 16.15 in E5194); 15.92 years among those still alive.
117 IBR events (65 invasive, 52 DCIS). 15-yr IBR 11.4% (7.9-15.5) with tamoxifen vs 19.0% (15.3-22.9) without, P=.001. On multivariable analysis HR 0.54 (0.35-0.83) for any IBR and HR 0.43 (0.24-0.77) for invasive IBR; DCIS-IBR was not significantly reduced (P=.089).
Beyond the non-randomized exposure, the tamoxifen groups differ on the axes that predict recurrence: trial of origin (55.0% vs 21.8% from 9804), negative re-excision (27.2% vs 10.6%) and size ≤5 mm (57.0% vs 41.3%). Duration of tamoxifen, adherence and receptor status are not given in the source, so a dose- or ER-defined read is unavailable.
The split between a significant invasive-IBR reduction and a null DCIS-IBR effect is the part worth carrying: it argues the drug is acting on the events that carry downstream consequence rather than uniformly suppressing recurrence. Whether that separation is biology or a power artifact of 52 DCIS events is not settled here.
NRG/RTOG 9804 itself established that RT reduces IBR in this same good-risk cohort, so the field now has magnitudes for both omission levers in one population. The source reports no direct RT-versus-tamoxifen comparison, and the pooled cohort cannot supply one.
Tamoxifen was optional and unrandomized in both parent trials; users differed on trial of origin, re-excision status and pathologic size, so confounding by indication is unadjustable away.
- Whether the invasive-only benefit reflects biology or DCIS-event power
- Optimal tamoxifen duration in RT-omitted good-risk DCIS active Trial of Low Dose Tamoxifen in Women With Breast Intraepithelial Neoplasia - Long Term Follow-up Phase 3n=500 · primary completion 2022-12 · tamoxifen 5mg/d vs placebo in ER+ DIN, long-term
- Whether ER status selects who benefits in DCIS recruiting DCIS: RECAST Trial Ductal Carcinoma In Situ: Re-Evaluating Conditions for Active Surveillance Suitability as Treatment Phase 2n=400 · primary completion 2028-11 · randomised endocrine agents in HR+ DCIS onlynot yet Avoiding Surgery in Estrogen Receptor Positive Atypical Ductal Hyperplasia and In-situ Carcinoma Treated With Endocrine Treatment Trial Phase NAn=340 · primary completion 2032-12 · ER+ DCIS/ADH, 5y invasive IBC on endocrine alone
📚 Sources · 📄 1 paper
Abstract
Bladder-preserving TMT multicenter analysis (URONCOR)
ForcT2-T4aN0M0 MIBC treated with definitive TMT, median age 76
TL;DRCLR 63.7% in a 369-pt Spanish TMT cohort; salvage cystectomy 9.7%, image-guidance quality and 5-FU-based CRT predicted local response.
The modifiable RT variable here is verification protocol: weekly portal imaging carried OR 0.35 (0.20-0.60) for complete local response, with VMAT trending favorable, across a 2010 to 2022 accrual. Dose, fractionation and target volume are not reported in source, so what transfers is the case for daily volumetric IGRT in a filling, moving organ.
In cT2-T4aN0M0 MIBC pts in their seventies weighing bladder preservation against cystectomy, this real-world series supports TMT delivered with modern image guidance and a 5-FU-based backbone; it does not inform node-positive or metastatic disease and carries no head-to-head against radical cystectomy.
Verification protocol is the modifiable variable: weekly portal imaging carried OR 0.35 (0.20-0.60) for complete local response, with VMAT trending favorable. Dose, fractionation and target volume are not reported in source, so what transfers is the case for daily volumetric IGRT and adaptive planning rather than a specific prescription.
The concurrent backbone mattered: 5-FU-based CRT carried OR 4.9 (1.1-22.1) for complete local response, though the CI leaves the magnitude open and comparator regimens are unnamed in source. Systemic failure at 10.7% ran at or above local-only failure at 10.1%, keeping perioperative systemic therapy questions live.
Salvage cystectomy was performed in 9.7% against 28.8% who progressed, so in a median-age-76 cohort most failures were not surgically rescued. With no in-cohort cystectomy comparator, this informs counseling on bladder preservation for cT2-T4aN0M0 disease without establishing equivalence to upfront radical cystectomy.

10 details
Multicenter retrospective cohort, Spain, 2010 to 2022, N=369 treated with definitive trimodality therapy (maximal TURBT then concurrent chemoradiotherapy). Predictors of response identified by multivariable logistic regression. Follow-up duration not reported in source.
cT2-T4aN0M0 MIBC selected for bladder preservation. Median age 76, 85.1% male. Fitness for cystectomy and completeness of TURBT are not reported in source.
Concurrent chemoradiotherapy, regimen at each center's discretion. 5-FU-based CRT predicted higher complete local response (OR 4.9, 95% CI 1.1-22.1, p=0.038). The comparator regimens are not named in source.
Dose, fractionation and target volume are not reported in source. The only technique signals reported are verification frequency (weekly portal imaging, OR 0.35 for CLR) and a non-significant trend favoring VMAT.
Primary: complete local response (CLR). Secondary: OS, CSS, recurrence patterns, salvage cystectomy. No OS or CSS estimate appears in the source, so the survival half of the conclusion cannot be checked.
CLR 63.7%, salvage cystectomy 9.7%. Progression 28.8%, with systemic failure (10.7%) running at or above local-only failure (10.1%).
BC2001 established the locoregional-control gain from adding chemotherapy to bladder radiotherapy, and the pooled RTOG bladder-preservation experience set the complete-response benchmark; both were protocol populations. This adds European real-world multicenter data at a median age of 76, with no internal cystectomy comparator.
No follow-up duration, OS or CSS estimate is reported, so the durability behind the preservation claim cannot be judged. The 5-FU odds ratio spans 1.1 to 22.1, compatible with a marginal or a large effect, and in a retrospective series regimen choice tracks renal function and performance status.
Systemic failure at 10.7% running at or above local-only failure at 10.1% argues the ceiling in this population is micrometastatic disease rather than the bladder, which caps what further local intensification can buy. Read conservatively, the predictors favor modern image guidance and an active concurrent backbone, not any specific verification schedule.
Retrospective multicenter cohort with no cystectomy comparator; imaging and chemo predictors come from multivariable regression across a 2010-2022 era shift, so a causal reading is unsupported.
- Does daily volumetric IGRT improve complete local response vs weekly portal imaging?
- Which concurrent chemotherapy backbone maximizes complete local response in TMT?
- Long-term bladder-intact survival vs radical cystectomy in matched populations
📚 Sources · 🐦 1 tweet
📢 Presentamos en #ESTRO26 nuestro análisis multicéntrico sobre preservación vesical en cáncer vesical músculo-invasivo tratado con TMT.
— URONCOR (@URONCOR) May 19, 2026
🔎 En 369 pacientes, la respuesta completa clínica se asoció a menor recurrencia local y mejor supervivencia!@fcounago #NicoFeltes pic.twitter.com/aQjjkcHGP4